
Enterprise Complications
Best For: Chief Operating Officers (COOs), Chief Transformation Officers, Operations Executives, Enterprise Architects, Business Process Management Leaders, Digital Transformation Leaders, PMO and Enterprise Change Leaders, Strategy & Operations Consultants
Reading Time: 20-30 minutes
Depth: Intermediate
Written By: UntangeOps Specialist Team
Executive Summary
The operational complexity problem is not that large organizations become merely “bigger.” It is that each increment of scale adds interfaces, variants, controls, approvals, data definitions, and local accommodations faster than the organization strengthens the operating model required to absorb them. In practice, complexity compounds at the seams: between functions, between systems, between regions, between legacy and new ways of working, and between formal policy and frontline reality. Research and benchmarking from operating-model, process-management, and organization-design literature align on the same pattern: organizations often redesign structure repeatedly, but lag in process ownership, decision rights, KPI standardization, data governance, and capability harmonization. [1]
The practical consequence is a widening gap between scale and maturity. Recent executive research found that even high-performing companies can leave roughly 30 percent of strategic potential undelivered because of operating-model shortcomings; firms that behave as “one firm” are 2.3 times more likely to land in the top quartile of healthy, high-performing organizations. At the same time, large organizations show persistent weaknesses in measurement coherence and worker capacity: only 38 percent of organizations in one APQC survey considered their measures effective for decision-making, 56 percent said measures were not standardized across business groups, Bain reports the average company loses 21 percent of productive power to time-wasting interactions, and Deloitte reports that survey respondents spend 41 percent of their daily time on work that does not contribute to organizational value. [2]
Complexity therefore shows up in a recognizable set of symptoms: shadow processes, duplicate workflows across divisions, siloed systems, unmanaged regional variation, governance overhead, exceptions becoming normalized, and employee workarounds. These are not isolated defects. They are linked phenomena in which variance creates local fixes, local fixes create debt, debt creates more approvals and reconciliation, and increased overhead further reduces the organization’s capacity to redesign the root process. Process-entropy research, process-mining literature, shadow-IT/workaround studies, and government duplication analyses all point to the same dynamic: unmanaged variation degrades control, speed, transparency, and cost. [3]
The most reliable response is not a single transformation program. It is an operating discipline. Enterprises that improve complexity at scale tend to do five things consistently: they define enterprise capabilities and end-to-end process ownership; separate nonnegotiable standards from permitted local variation; consolidate common capabilities onto shared platforms or global business services where economics justify it; redesign decision rights to reduce governance drag; and instrument the whole system with process-mining, conformance, exception, and maturity metrics. Where published benchmarks are explicit, the upside is material: rightsizing spans and layers can save 10 to 15 percent of managerial cost; platform operating models have been associated with 15 to 20 percent cost savings and two- to fourfold faster time to market; and holistic operating-model shifts have been associated with 10 to 30 percent gains in customer satisfaction, operational performance, and efficiency, alongside major increases in decision speed. [4]
Why complexity outpaces maturity
The core thesis can be stated rigorously: organizational scale increases combinatorial interaction, while operational maturity increases only when the enterprise deliberately invests in standardization, ownership, governance, data, and capability coherence. Adding a product line, region, channel, regulatory requirement, or acquired business rarely creates one new variable. It creates new handoffs, new arguments over authority, new master-data dependencies, new exception cases, and new needs for reconciliation. That is why complexity usually expands faster than headcount, and why operating maturity usually lags if it is pursued as a side effect of systems implementation or restructuring rather than as a design objective in its own right. [5]
The literature also shows why organizations misdiagnose the problem. Leaders often focus on structure alone, but structure by itself does not create value; what matters is the coherence of the wider operating system, including decision rights, metrics, skills, incentives, governance routines, and technology. McKinsey’s recent operating-model work explicitly argues that redesigning boxes on an org chart is insufficient, while Deloitte’s organization-design work shows that decision rights are often treated as an accidental byproduct of structure rather than as a design object. That pattern is one reason enterprises keep “reorganizing” without materially reducing friction. [6]
A second source of acceleration is the global/local tension. Standardization creates scale economies, simplification, and consistency, but regional markets, regulations, risk profiles, and customer behavior create legitimate local needs. The organizations that manage this tension best do not pick absolute centralization or absolute decentralization; they use federated models with a central standards core and explicit local layers for justified adaptation. Lenovo’s global SAP transformation is a strong published example: the company deliberately pursued one strategic platform while preserving selected local differentiation for pricing approvals, sales interactions, and market-specific commercial practices. [7]
The diagram below summarizes the mechanism described across the research:
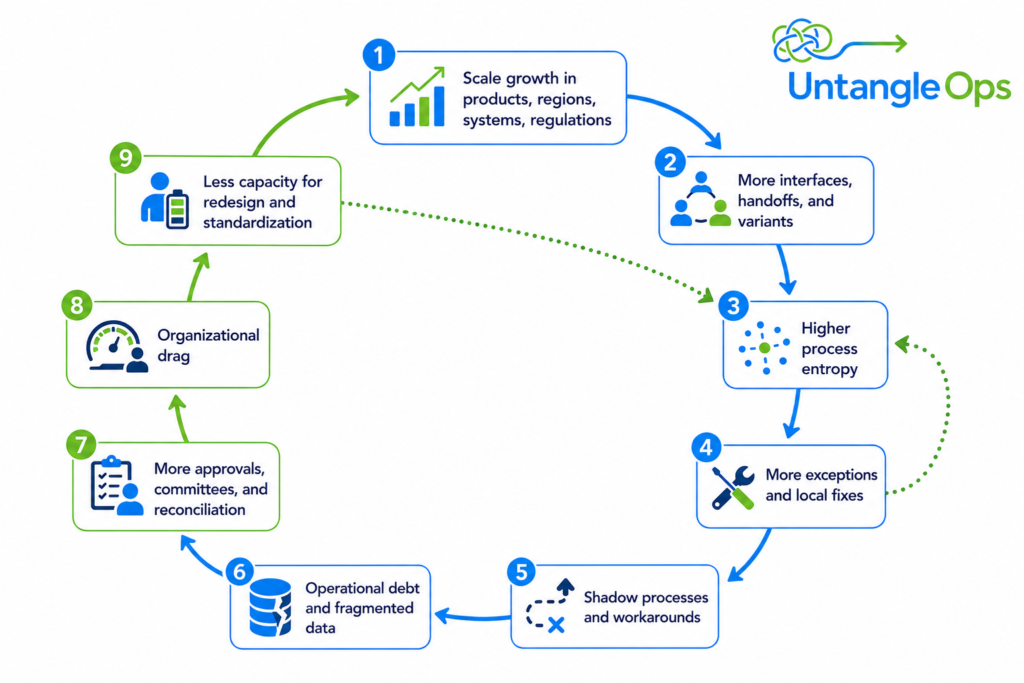
This cycle is observable in both enterprise and public-sector settings. The more duplication, overlap, fragmentation, and exceptions accumulate, the more risk shifts from isolated defects to systemic drag: slower decisions, inconsistent controls, poor data quality, access barriers, higher costs, and weaker accountability. GAO’s long-running work on fragmentation and duplication is especially useful because it makes the point in hard institutional terms: unmanaged overlap and fragmentation increase costs, create inconsistent information, and degrade service effectiveness. [8]
Where complexity shows up
Shadow processes. Shadow processes emerge when the formal process or system cannot deliver the throughput, usability, or local fit required by the work. The mechanism is straightforward: employees introduce unofficial handoffs, side trackers, spreadsheets, messaging groups, and manual controls to keep work moving. IBM’s definition of shadow IT captures the same basic pattern at the technology layer: employees adopt unsanctioned tools because they are faster to start or fit the work better than approved alternatives. In the published Department of State and USAID listening report, employees explicitly linked poor technology to workarounds and shadow processes, and the report’s workaround table shows IT, HR, procurement/contracting, and program planning as the most common workaround domains. The measurable impact is usually visible in duplicate data entry, rework, missing audit trails, security exposure, and time spent reconciling “official” versus “actual” states. Relevant KPIs are shadow-application count, unofficial data-store count, manual reconciliation hours, rework rate, and security/compliance incidents. Mitigation requires a nonpunitive census of shadow workflows, triage by business criticality, rapid remediation of high-volume pain points, and a clear pathway for sanctioning useful local innovations. The trade-off is that overly aggressive suppression can drive workarounds deeper underground. [9]
Duplicate workflows across divisions. Duplication is not just wasteful repetition; it is a capability-allocation failure. GAO’s definitions distinguish fragmentation, overlap, and duplication, and its annual reports show that duplication and overlap consistently create inefficiency, weak information consistency, and large financial consequences. In private enterprises, the same dynamic appears when different divisions maintain separate onboarding, procurement, reporting, or pricing workflows for basically similar work. The mechanism is usually historical accretion: legacy autonomy, acquisitions, differing local systems, or parallel support functions. The impact shows up in higher unit cost, inconsistent controls, fragmented vendor leverage, incompatible KPIs, and weaker reuse of talent and technology. Useful KPIs include process variants per core process, FTEs per transaction by business unit, duplicate application count, percent shared-service coverage, and policy divergence across units. A real mitigation path starts with a capability map and a process-taxonomy baseline, then makes a hard choice about what should be shared, what can vary, and what must be retired. The trade-off is political: duplication often persists because it protects local power and budget. [10]
Siloed systems. Data and systems silos are among the most reliable predictors of operational complexity because they create multiple “truths” for the same transaction. IBM defines data silos as isolated collections of data that prevent sharing across departments, systems, and business units; Salesforce’s research reports that 81 percent of IT leaders say data silos hinder digital transformation, and a separate Salesforce study reported data silos as a challenge for 90 percent of organizations facing integration obstacles. Process-mining and operating-model research show why this matters operationally: when the event history of a process is split across systems, the enterprise loses visibility into bottlenecks, rework loops, and exception patterns. The resulting impacts include reconciliation effort, duplicate records, broken automation, inconsistent reporting, and slower decisions. Good KPIs are duplicate-record percentage, integration latency, manual touch rate, number of system-of-record disputes, master-data defect rate, and cross-system cycle-time variance. Mitigation is not only “replace the systems.” It is usually a staged program of system rationalization, master-data governance, event-log instrumentation, and a deliberately designed shared data layer. The trade-off is cost and sequencing risk: forced consolidation without process simplification can simply centralize a bad design. [11]
Regional variations. Regional variation is both necessary and dangerous. It is necessary because regulation, customer expectations, market maturity, and local ecosystems do differ. It becomes dangerous when the enterprise does not distinguish justified variation from inherited noise. McKinsey’s global/local research argues for a federated core-plus-local-layer model precisely because unmanaged localization multiplies complexity and prevents scale, while Lenovo’s case shows the operational discipline required: one strategic platform, plus explicit permission for selected local differentiation. The measurable impact of regional sprawl shows up in ERP-instance proliferation, local pricing-approval paths, country-specific master-data definitions, fragmented customer views, and greater training/support costs. Relevant KPIs include approved versus unapproved regional variants, cost per region-specific deviation, number of regional systems for the same capability, and cycle-time variance across countries for the same process. Mitigation means defining enterprise “must-standardize” elements, explicit local-option catalogs, and a review cadence for every local variant. The trade-off is not abstract: overcentralization can damage local market fit, while unchecked regional autonomy creates persistent entropy. [12]
Governance overhead. Governance overhead is the point at which control architecture becomes a flow problem. Research on decision rights shows that organizations frequently struggle with decision making, and both McKinsey and Deloitte argue that unclear authority, too many veto points, and weakly designed forums slow decisions and reduce efficiency. BCG’s recent cost-program work says much the same in more pointed terms: excessive layers and bureaucracy create operational friction, and change programs can make the problem worse when they add committees rather than remove ambiguity. The mechanism is queueing: more approvals, more pre-reads, more meetings, more rework after stakeholder objections, and more time spent aligning the same decision multiple times. The impact is measurable through approvals per decision, days in queue versus actual touch time, recurring governance forums and leadership meeting hours. Mitigation requires a decision inventory, one accountable owner per decision, escalation thresholds, review forums with explicit charters, and pruning of low-value committees. The trade-off is real: cutting governance indiscriminately risks weaker control, but leaving governance unbounded creates drag that undermines both speed and control quality. [13]
Exceptions becoming the norm. A mature operating model treats exceptions as bounded deviations; an immature one lets frequent exceptions redefine the base process. Process-mining documentation is explicit that skipped steps, loops, rework, and deviating variants are measurable, and SAP’s Signavio materials emphasize benchmarking by company code, document type, transaction-code usage, and variant-level metrics precisely because “actual” execution often drifts from the modeled process. When the same “temporary” exception recurs at meaningful volume, it stops being an exception and becomes an undocumented operating variant. This is one of the clearest signs of process entropy. The impact appears as falling straight-through processing, higher manual override rates, wider cycle-time dispersion, lower conformance, and eventually control breaks. KPIs should therefore include exception rate, repeat-exception rate, rework-loop frequency, conformance percentage, and the percentage of cases flowing through the top variants. The mitigation is to force a design choice: absorb the recurring condition into the standard process, or eliminate the cause. The trade-off is that a rigid rulebook can turn legitimate adaptation into silent workaround behavior. [14]
Why employees create workarounds. The strongest literature is clear that employees usually create workarounds because the official system, process, or policy does not fit the job as actually performed. Steven Alter’s workaround theory is still foundational here: workarounds are not random deviance but patterned responses to misfits in operational systems. Wong and colleagues show that inadequate information systems induce workaround behavior; Davison and colleagues show how a mandated global enterprise system that does not fit local realities produces coordinated, persistent workarounds; IBM’s shadow-IT guidance adds the frontline view that employees adopt unsanctioned tools because they are more convenient or functional than approved alternatives; and shadow-IT justification research shows that IT constraints make noncompliance socially acceptable inside teams. The measurable implication is that workaround behavior is an organizational signal, not just a user defect. Relevant KPIs include workaround incident counts, shadow-tool prevalence, unresolved pain-point tickets, policy waiver volume, and training-to-override ratios. Mitigation requires fixing the misfit, not just communicating the rule. The trade-off is that some workarounds do create local value, so enterprises should separate harmful bypasses from adaptive learning. [15]
Advanced concepts and case illustrations
Process entropy is the best analytical lens for understanding why mature-looking process maps often collapse under real execution. The academic literature has developed entropy- and graph-entropy-based measures of process complexity and has shown that variability in event logs correlates with the quality and complexity of discovered process models. In practical terms, high entropy means too many materially different ways of completing the same nominal process, often driven by local exceptions, unmanaged attributes, and historical layering. A useful enterprise metric is a process entropy index built from normalized variant entropy, repeat-exception rate, and rework-loop frequency. [16]
Organizational drag is the cumulative productivity tax imposed by low-value interactions, overlayered management, and bureaucratic coordination. Bain’s research quantifies the phenomenon in lost productive power, while Deloitte’s worker-capacity work shows how complexity manifests as digital busywork, interruptions, and work that does not create value. A practical organizational drag index can combine leadership meeting load, approvals per decision, queue time, layer count, and time spent on non-value work. [17]
Capability duplication is broader than duplicate systems. The formal architecture literature defines capability duplication/overlap as multiple fielded capabilities serving a single capability function. In enterprise practice, BCG’s platform literature makes the same point from an operating-model angle: organizations reduce duplication by turning repeated small-scale functions into shared enterprise platforms or global business services. The right metric is not only application count but a duplicate capability ratio: the number of materially overlapping capabilities, teams, or services divided by the number of distinct enterprise capabilities. [18]
Operational debt is an applied management term in this report rather than a universally standardized academic label. It extends the logic of technical debt to the operating model: deferred fixes in process, policy, controls, data, and role design that preserve short-term throughput while raising future cost, risk, and redesign difficulty. The supporting mechanism is well grounded in the literature on tech debt, workarounds, shadow IT, and process inconsistency, even if the label itself is still maturing. A practical operational debt backlog should include aged exceptions, unsupported local apps, recurring reconciliations, custom transactions, and manual controls attached to high-volume processes. [19]
Credibility signal is also used here as an applied diagnostic label: whenever teams create shadow trackers, side reconciliations, or manual “proof packs” around an official process, they are signaling that the formal process or system is not sufficiently trusted for timely, accurate execution. Workaround and shadow-IT research strongly supports the underlying mechanism: when official systems constrain performance, employees justify and coordinate alternatives. In practice, credibility signal should be measured through unofficial tracker prevalence, audit-evidence assembled outside the system of record, and the ratio of “actual decision process” to “documented decision process.” [20]
Three case patterns illustrate the model. First, the State/USAID listening report shows the public-sector version of the problem: poor technology, manual work, and shadow processes clustered in exactly the functions one would expect to become overloaded first. Second, Lenovo’s post-merger global transformation shows a more disciplined enterprise response: one strategic platform, explicit scope control, and justified differentiation rather than uncontrolled local proliferation. Third, the multinational enterprise-system case in the workaround literature shows how local realities can keep generating persistent workarounds until governance recognizes the misfit as a design problem rather than a compliance problem. [21]
Comparative mitigation approaches
The comparative assessment below synthesizes the strongest patterns across the literature. “Effectiveness” reflects the best available published evidence where the sources were explicit and directional judgment where they were not.
| Mitigation approach | Primary target | Cost | Typical time to implement | Expected effectiveness | Main risks | Best first implementation step |
| End-to-end process ownership and standardization | Shadow processes, duplicate workflows, recurring exceptions | Medium | 3–9 months for priority processes | High for consistency and conformance; foundational for all later system work | Can overstandardize and suppress legitimate local needs | Name global process owners and map top 10 value-stream processes |
| Federated core/local operating model | Regional variation, local workarounds, global/local tension | Medium | 3–6 months for design; 6–18 months to scale | High when variation is legitimate but bounded | Ambiguity if “must standardize” vs “may vary” is not explicit | Create a three-bucket catalog: global standard, permitted local option, prohibited local divergence |
| Platform operating model or global business services | Capability duplication, siloed support functions, handoff burden | High | 6–18 months | High; published cases cite 15–20% cost savings and 2–4x faster time to market | Turf resistance, weak product ownership, underpowered governance | Start with one high-volume shared capability such as onboarding, procurement, or reporting |
| Decision-rights redesign and spans/layers reset | Governance overhead, slow decisions, role confusion | Medium | 2–6 months | High; published spans/layers work cites 10–15% managerial cost opportunity and often removal of at least one layer | “Decluttering” can weaken control if accountability is not rebuilt | Build a decision inventory and assign one accountable owner per top decision |
| Process mining and conformance management | Exceptions, hidden variants, rework, low visibility | Medium | 2–4 months for initial instrumentation | High as a diagnostic and monitoring layer | Poor source data can create false confidence | Instrument one priority end-to-end process with event logs and baseline its top variants |
| System rationalization plus master-data governance | Siloed systems, duplicate records, reconciliation load | High | 9–24 months | High, but benefits arrive slower than governance/process actions | Very high execution risk if process design is not simplified first | Freeze net-new local tools for the target domain and establish one canonical data model |
| Exception architecture with expiry rules | Exceptions becoming normal, hidden local policies | Low–Medium | 1–3 months | Medium to high; rapid reduction in unmanaged variance | Can create bureaucracy if every exception demands a committee | Require owner, reason code, volume, risk rating, and expiry date for every exception |
| Capability mapping and duplicate-capability retirement | Capability duplication, budget sprawl, hidden overlap | Medium | 3–6 months | Medium to high; especially powerful after M&A or function redesign | Local leaders may relabel duplicates as “unique” to preserve control | Build an enterprise capability map and identify overlaps by owner, spend, and process served |
The quantitative anchors in the table come from published spans-and-layers, operating-model, and platform work: rightsizing spans often removes at least one layer and can save 10 to 15 percent of managerial costs; platform operating models are associated in published cases with 15 to 20 percent cost savings and two- to fourfold faster time to market; and holistic operating-model redesigns have been associated with 10 to 30 percent gains in customer satisfaction, operational performance, and efficiency, plus major gains in speed and engagement. The sequence implied by the literature is also important: process and decision clarity usually need to precede large-scale systems consolidation if the enterprise wants durable results. [22]
Metrics and dashboard
A complexity dashboard should not track only performance outcomes. It should track the relationship between complexity load and operational maturity. APQC’s KPI work is a strong warning here: organizations already struggle when measures are not standardized, data quality is weak, and sources are inconsistent. The dashboard therefore needs a common process taxonomy, a standard metric dictionary, and event-level data wherever possible. Process-mining guidance from SAP, Celonis, and Microsoft is useful because it operationalizes variant coverage, throughput, rework, conformance, and case counts in a way that can be compared by region, company code, document type, or business unit. [23]
| Dashboard dimension | Recommended metric | Why it matters | Typical warning signal |
| Process stability | Variant count for each tier-1 process | Direct measure of execution dispersion | Variant count rising faster than case volume |
| Process entropy | Normalized variant entropy or top-variant concentration | Detects when “same process” is no longer really the same | Falling concentration in the top 3 variants |
| Conformance | Percentage of cases conforming to target model | Shows how much work actually follows the designed path | Conformance below target while exceptions rise |
| Rework and exception pressure | Rework rate, manual override rate, repeat-exception rate | Reveals where exceptions are becoming routine | Repeat exceptions cluster in the same step or region |
| Governance load | Approvals per decision, queue time/touch time, active governance forums | Measures drag rather than only decision output | Queue time dominating actual working time |
| System fragmentation | Apps per value stream, duplicate-record rate, system-of-record disputes | Exposes silo cost and reconciliation burden | More than one “official” source for the same data object |
| Capability duplication | Duplicate capability ratio, percent spend on overlapping services | Makes overlap visible at enterprise level | Two or more owners funding similar services for the same process |
| Shadow activity | Shadow-tool count, unofficial tracker prevalence, sanctioned vs unsanctioned usage | Measures hidden operating reality | Shadow usage rising in high-volume domains |
| Maturity coverage | Percent of tier-1 processes with owner, KPI set, standard data source, and documented decision rights | Tracks whether maturity is catching up | Scale expanding while coverage remains flat |
| Worker capacity | Time on non-value work, meeting hours, focus time, escalation frequency | Connects complexity to human throughput | Rising meeting load with flat output quality |
| Outcome layer | Cycle time, straight-through processing, first-pass yield, cost per transaction | Validates whether simplification is producing value | Cost or cycle time improvement stalls despite more controls |
The most useful executive view is a two-axis dashboard: complexity load on one side and maturity coverage on the other. A practical enterprise formula is to compute a Complexity Pressure Index from variant count, exception rate, approval count, system count, and shadow activity, then compare it with a Maturity Coverage Index built from owner coverage, KPI standardization, canonical data-source coverage, conformance, and decision-rights clarity. If complexity pressure rises while maturity coverage is flat, the enterprise is accumulating operational debt even if short-term service levels still look acceptable. [24]
Organizational design, governance, and implementation
The design goal is not maximum centralization. It is minimum viable complexity: the smallest amount of structural, system, and policy variation needed to serve strategy, regulation, and market reality. The most robust organizational pattern in the sources is a combination of one-firm coherence, end-to-end process ownership, federated global/local design, and shared platforms or global business services for repeatable capabilities. Published research on corporate functions points in the same direction: rather than preserving rigid silos, organizations increasingly deconstruct functions and reassemble capabilities around business and human outcomes, often through shared-service or business-platform constructs. [25]
A practical governance model looks like this:
![Flowchart
A[Executive committee / board] --> B[Enterprise design authority] B --> C[Global process owners] B --> D[Enterprise platform or GBS leaders] C --> E[Value-stream councils] D --> E E --> F[Regional / local process stewards] F --> G[Time-boxed exception board] G --> E](https://untangleops.com/wp-content/uploads/2026/06/chart-1024x683.png)
In this model, the enterprise design authority owns capability taxonomy, standard definitions, and the rules for what may vary. Global process owners own the target process, KPI set, and conformance. Platform or GBS leaders own reusable capabilities and shared economics. Regional stewards own compliant execution and bring justified local needs upward. Exception boards are not permanent legislatures; they are fast, time-boxed mechanisms that either absorb recurring conditions into the standard process or retire them. This structure matches the strongest findings from federated operating-model research, decision-rights work, platform models, and GRC maturity analyses. [26]
Implementation should proceed in deliberate waves. In the first 60 to 90 days, conduct a complexity diagnostic: build the capability map, inventory shadow processes and local tools, baseline the top three value streams with process mining, identify decision bottlenecks, and standardize the KPI dictionary. In the next 90 to 180 days, redesign governance and ownership for the highest-friction domains, define the global-versus-local catalog, and kill or sanction the most consequential shadow workflows. Over the next 6 to 12 months, rationalize duplicate capabilities and systems in the priority domains, move selected repeatable work onto platforms or shared services, and institutionalize a complexity dashboard reviewed at the same level of seriousness as financial performance. The sequencing matters because the literature is clear that tools and systems do not fix unmanaged processes on their own. [27]
The main trade-offs should be explicit from the beginning. More standardization increases scale and transparency but can damage local fit. More local freedom preserves responsiveness but increases entropy. More governance can improve control but can also create drag. More simplification can increase speed but may reduce redundancy that previously buffered risk. The answer is not to eliminate these tensions; it is to make them visible and govern them consciously, with metrics, ownership, and sunset rules. The organizations that do this best do not promise “no complexity.” They treat complexity as a scarce resource to be budgeted. [28]
Open questions and references
Open questions / limitations. Two terms in this report are applied synthesis terms rather than fully standardized labels across the literature: operational debt and credibility signal. The mechanisms behind them are well supported by research on technical debt, process entropy, shadow IT, and workarounds, but enterprises should define the measures explicitly before using them in formal dashboards. Also, several published benchmarks in consulting sources are directional and experience-based rather than universal causal estimates; they are still useful for prioritization, but not as guaranteed outcomes. Finally, some of the most operationally revealing case patterns in the literature are necessarily anonymized, which strengthens mechanism understanding but limits exact replication. [29]
Published On: 17 June, 2026
Tags:
Operational Complexity
Enterprise Operating Model
Operating Model Maturity
Organizational Complexity
Process Standardization
Process Governance
Process Mining
Operational Excellence
Shared Services
Enterprise Transformation
Let’s Untangle YOUR Operations
We have a proven methodology and can replicate our success for your organization. Easy.